Diagnostics
AllWhat it's for — Diagnostics is the runtime health dashboard for your CueSync installation. It surfaces cue timing, output connection history, the error feed, system resource usage, and a self-test so you — or support — can pinpoint problems quickly. The screen is off by default: switch it on in Settings → Advanced and restart CueSync. Until then it does not appear in the navigation bar.
The screen, region by region
The screen is a single scrollable column. Sections appear in this order:
Health banner — A colour-coded bar at the top: green (Healthy), amber (Warning), or red (Critical). This reflects the worst condition of any monitored subsystem.
Beat Pipeline — Three cards (Cue engine, Auto Pilot, Waveform) showing typical and worst-case timing. A value turns amber, then red, as timing degrades. A "Waiting for beats" message shows until a Pioneer player or the internal clock starts sending events.
Active warnings — Only visible when at least one warning is active. Each entry shows the source system and the warning text. Warnings auto-clear when the underlying condition resolves.
License — The current license state, edition, offline grace remaining (if any), and the most recent validation failure reason. Use this when troubleshooting "why aren't my cues firing?" — the edition shown here is the one CueSync is actually enforcing.
Hardware telemetry — Displays the non-identifying device information CueSync shares when it checks your license — no serial numbers, MAC addresses, or unique identifiers. This is a transparency view; nothing here can be changed from within the app.
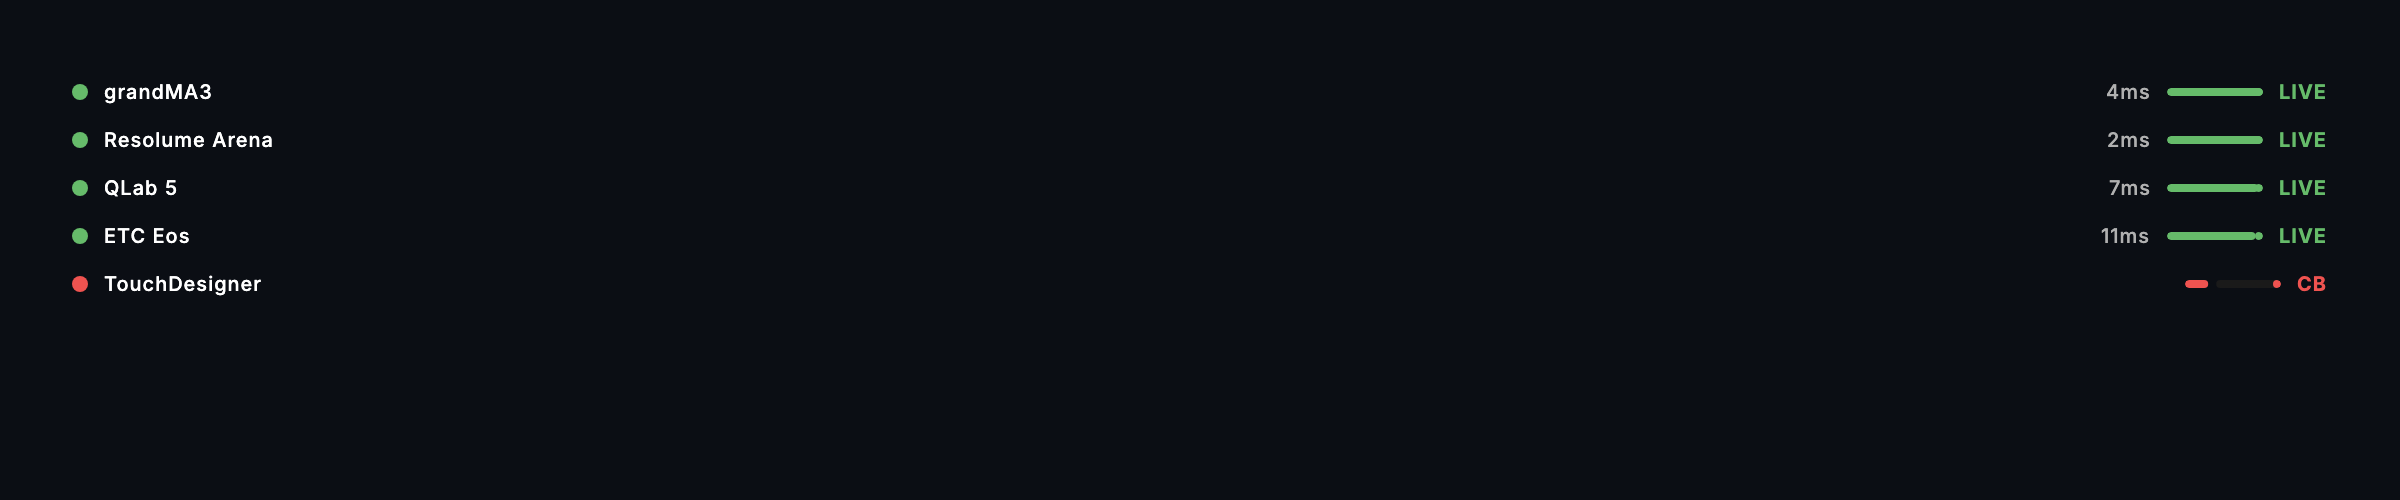
Connection health — Per-output uptime statistics: 1-hour and 24-hour uptime percentages. An output flagged as "FLAPPING" is connecting and disconnecting repeatedly — check the cable or the target software. An output that misses a heartbeat reads Degraded and returns to Connected as soon as the heartbeat answers; only consecutive misses count, and no flap or connect is logged for an output that never dropped.
Error feed — A timestamped list of the most recent errors across all subsystems, with a live errors-per-minute rate that turns amber, then red, as it rises. Use the Clear button to reset the feed (useful after fixing an issue to confirm it stops producing errors).
Recent connection events — A timestamped log of connects, disconnects, and outputs paused after repeated failures, for all outputs. Entries appear here the moment an event occurs.
System resources — CPU usage and memory (used / max). Both turn red as they near their limits.
Identify DMX Universes — Answers "which universe is this cable carrying?" without a patch change. Press Start and each connected Art-Net and sACN output transmits, on DMX channel 512, the number of every universe it has already driven; plug a DMX tester into an unknown cable and the value it reads is the universe number. It only identifies universes the output has already sent — it does not open new ones — so an output that has driven no universe yet has nothing to identify, and the screen says so. Press Stop, or walk away and let it stop itself after five minutes.
It borrows that channel and gives it back: whatever each universe was holding on channel 512 is recorded first and restored on stop, and any universe that could not be restored is named so you can check it before the show. Two things it refuses to do — it will not run at all while a show is playing or paused, and it will not identify a universe above 255, because one DMX channel carries 0–255 and its number cannot be stated exactly. Refused universes are listed with the reason rather than quietly skipped.
Self-test — Runs a built-in validation suite: cue firing test, connectivity ping to each configured output, and cue readiness check. Results show pass/fail with latency detail for each output. Click Run Self-Test to trigger a run; the button is disabled while a test is in progress.
Analysis cache — How much track analysis CueSync is holding, in memory and on disk. Only visible once a Pioneer player has connected and analysis has started.
Waveform cache — Status of the waveform display cache: Inactive, Cold, Warming or Hot. "Hot" means it is serving most of the drawing from memory. Visible even before a CDJ connects.
Library batch analyse — Shows the result of the most recent library-wide analysis run: total tracks, successes, failures and processing time. Shows "Awaiting first run" until you trigger a batch analyse from Track Prep.
Audio subsystem — Active clip count (out of 8), transport state, selected output device, and live peak and RMS level bars. Helps correlate "audio isn't playing" with concrete subsystem state.
GrandMA3 Feedback — Appears once a grandMA3 console has something to report, which needs OSC output enabled on the desk as well as input. Shows the age of the last feedback message and, on a TCP session, the last reported cue and the reconciliation status (In sync / Drifted). On UDP, the console reports to CueSync's own OSC input port (Settings → Advanced), so check that port matches the desk's OSC-out destination; the card lists it as "GrandMA3 (via CueSync's OSC input)" and, on a grandMA3 2.5 desk, shows each sequence's live cue. Amber means CueSync has never heard from the desk; a quiet desk is not a fault, because feedback is sent only when something moves. If CueSync fires an Executor Look and the desk does not answer, a sticky card says so and clears itself when feedback returns. See GrandMA3 §8.
Execution heatmap — Post-show visualiser of when and how often cues fired across the beat grid. Includes a Export CSV button that writes the heatmap to ~/.cuesync/heatmaps/ for post-show analysis.
Common tasks
- Check timing before a show — Look at the Beat Pipeline cards and confirm none is amber or red. If one is, look at the active warnings and error feed for the cause.
- Diagnose a failing output — Find the output in the Connection Health section, note its uptime percentage and whether it is flapping. Then scroll to Recent Connection Events to see the exact timestamps of its disconnect and reconnect cycles.
- Confirm license and edition — Read the License section. The edition shown is what is active right now. If a feature gate is blocking you unexpectedly, the validation failure reason here is the starting point for support.
- Run a pre-show self-test — Click Run Self-Test. All checks should pass. A failed connectivity result means the output address or port is wrong, or the receiving software is not running.
- Export an execution heatmap after a show — Scroll to the Execution Heatmap section and click Export CSV. The file appears in
~/.cuesync/heatmaps/with a timestamp in the filename.
Tips & gotchas
- Turn the screen on in Settings → Advanced → "Show the Diagnostics screen". It is off by default and takes effect the next time CueSync starts. Switching the screen on costs a live show nothing.
- Clearing the error feed does not fix anything. It only resets the display. If errors reappear immediately after clearing, the underlying issue is still active.
- The waveform cache "Inactive" status is normal when no tracks have loaded yet. It switches to "Cold" (first renders) and then rises toward "Hot" during a session as the cache fills.
- GrandMA 3 "Drifted" means CueSync sent a different cue than the console is reporting. This can happen if the console accepted a manual override between cue fires. In sync after the next matched fire is normal.
Related
- Network Outputs — Add and test outputs; view the Monitor tab for live latency graphs
- Devices — At-a-glance output health and PRO DJ LINK device status
- Settings — Tune timecode source timeout, audio pre-fire offset, and other parameters that affect the values shown here
Looking for a quick fix?
The Help Center has short task-focused articles and a support team that responds within 24 hours.